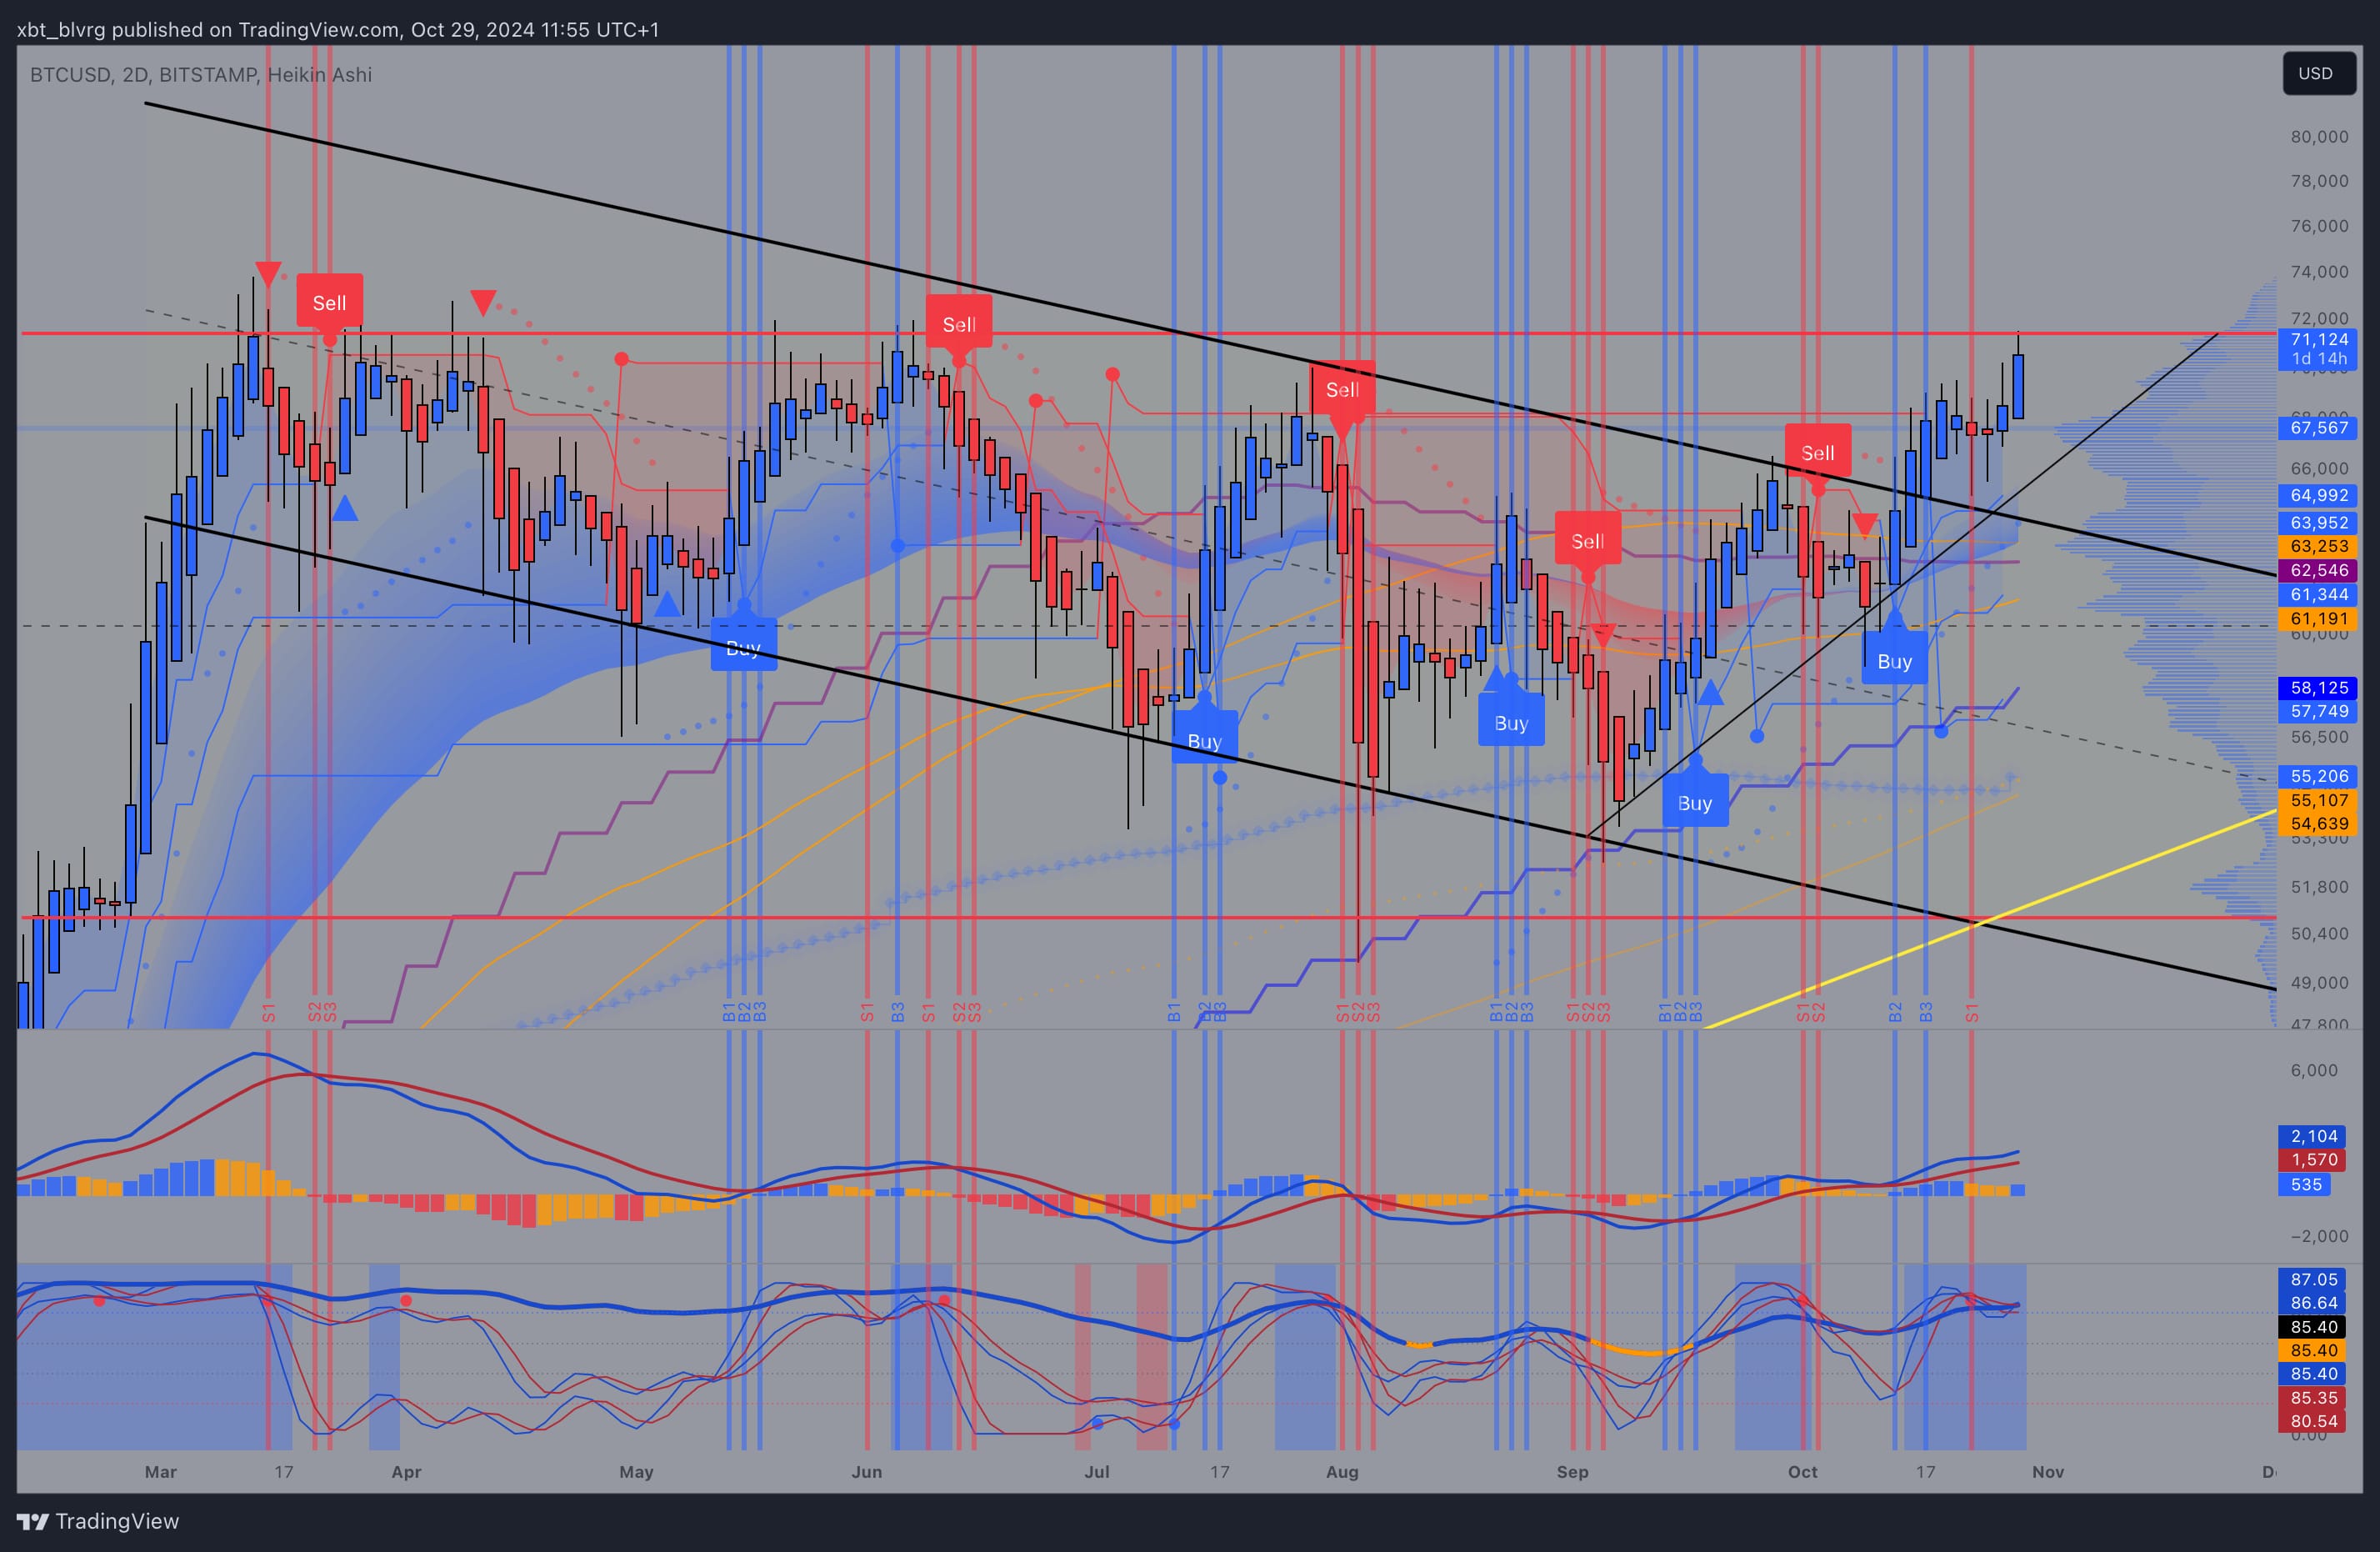
2D Chart Analysis
- Supertrends (Fast-, Mid-, Slow-ATRs): The fast-ATR Supertrend has flipped bullish, signaling initial upward momentum. The mid- and slow-ATRs provide support levels below the current price, reinforcing a positive trend bias.
- MA Cloud and EMAs: The short-term MA cloud (up to the 55EMA) acts as a support zone beneath the current price, indicating that the trend is supported in this higher timeframe. The price is well above the MA cloud, confirming strength in this timeframe.
- Longer-Term MAs (200MAs and Weekly MAs): The 200MAs and the 21-week and 50-week MAs provide additional support and show a strong bullish orientation, with the price comfortably above these levels. This setup indicates that the broader trend is upward.
- MACD: The MACD shows a bullish crossover, and the histogram suggests momentum is strengthening. This trend could persist if buyers maintain their pressure.
- Stochastic Indicators (StochClose, StochRSI, Stochastic): The combined StochClose (thick line), StochRSI, and (Slow)Stochastic metrics are in overbought territory. This suggests that while momentum is strong, some caution is needed as a correction could be on the horizon.
- Quantified 3-Factor Trading Matrix Signals: Multiple buy (B1, B2, B3) signals are visible, with recent sell signals (S1, S2, S3) above current levels. This setup suggests we may have seen a breakout or retest of previous resistance, now functioning as support.
Conclusion for 2D: The 2D chart shows strong bullish momentum, with the price well-supported above various moving averages and the MA cloud. However, the overbought conditions in the Stochastic indicators suggest a potential consolidation or mild correction before continuing higher.
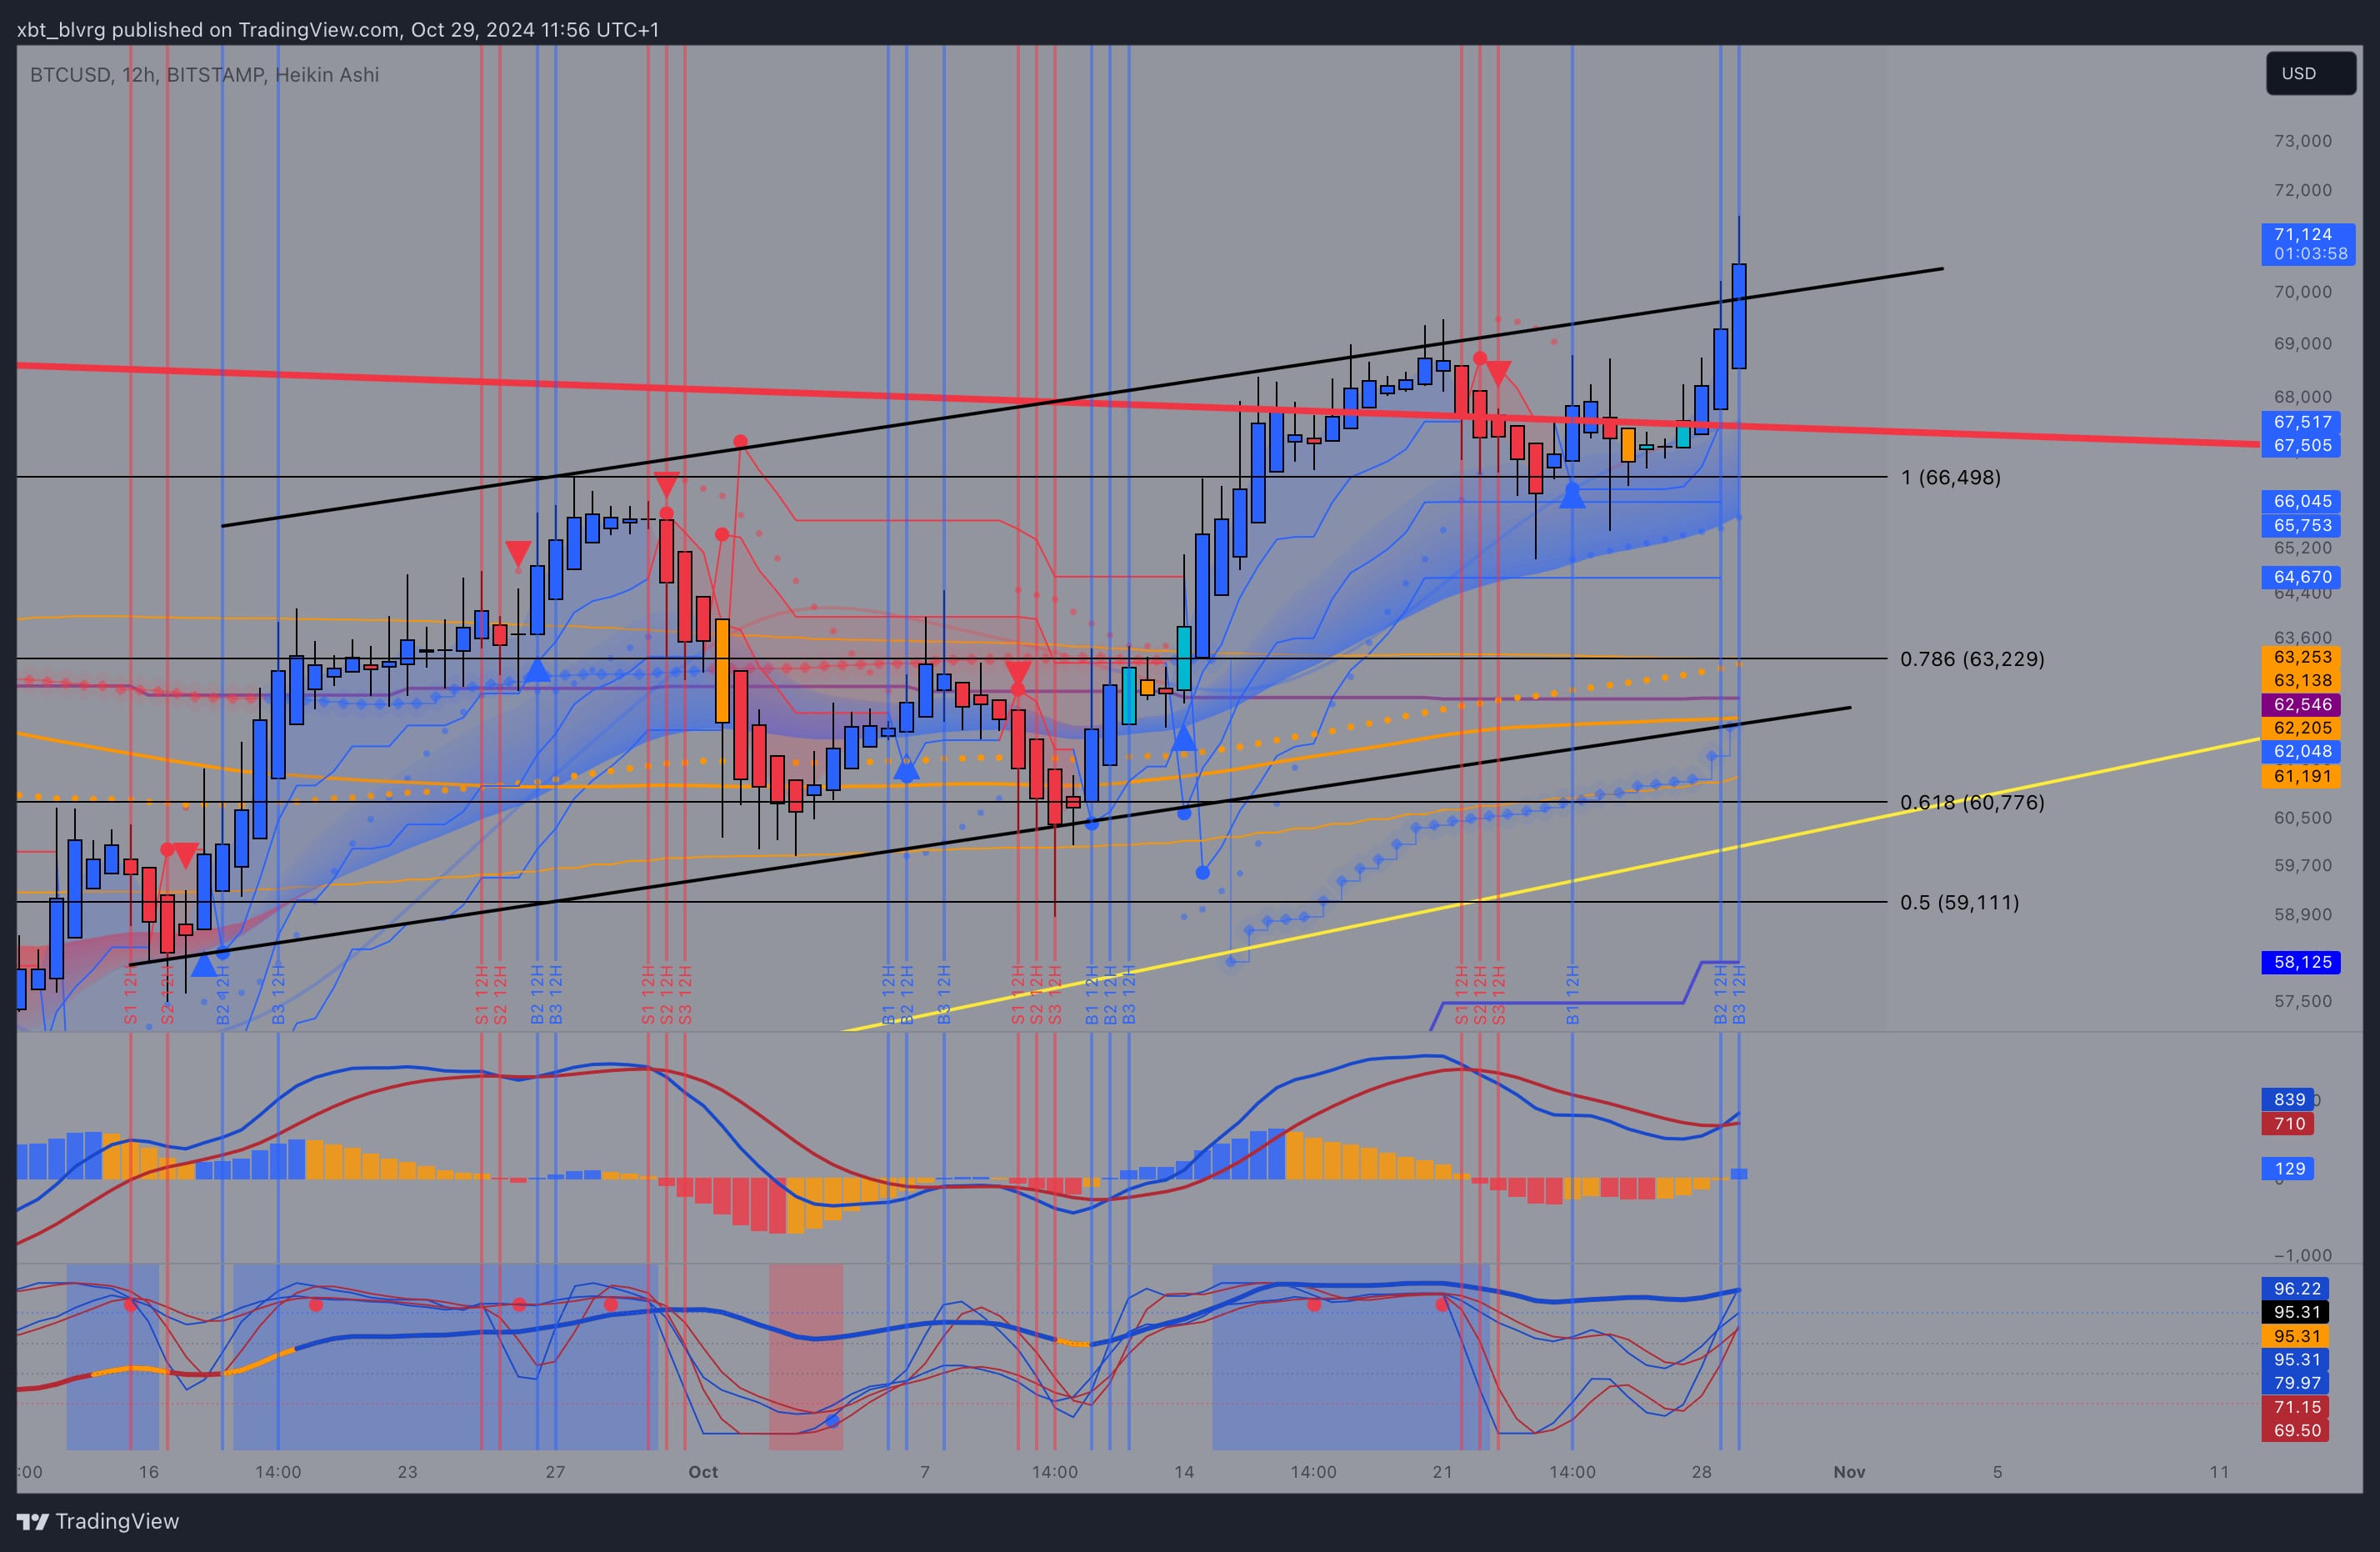
12H Chart Analysis
- Supertrends (Fast-, Mid-, Slow-ATRs): The fast-ATR Supertrend is bullish and aligns with the price’s upward direction. The mid-ATR and the slow-ATR are supportive and could act as support if the price retraces.
- MA Cloud and EMAs: The price has broken above the short-term MA cloud, which now serves as support. This is a bullish signal, reinforcing that buyers are in control in this timeframe.
- MACD: The MACD is in a bullish configuration, but the histogram shows signs of deceleration, suggesting that momentum might be slowing down slightly.
- Stochastic Indicators: The combined StochClose, StochRSI, and (Slow)Stochastic are close to overbought levels, indicating that a short-term correction might be likely if the upward momentum begins to wane.
- Quantified 3-Factor Trading Matrix Signals: Recent buy signals (B1, B2, B3) suggest that the breakout has been strong, but the proximity to sell signals indicates caution at higher levels.
Conclusion for 12H: The 12H chart suggests that the bullish momentum remains strong. Some deceleration in MACD and overbought Stochastic indicators imply a potential pullback or consolidation is plausible before resuming an upward trend.
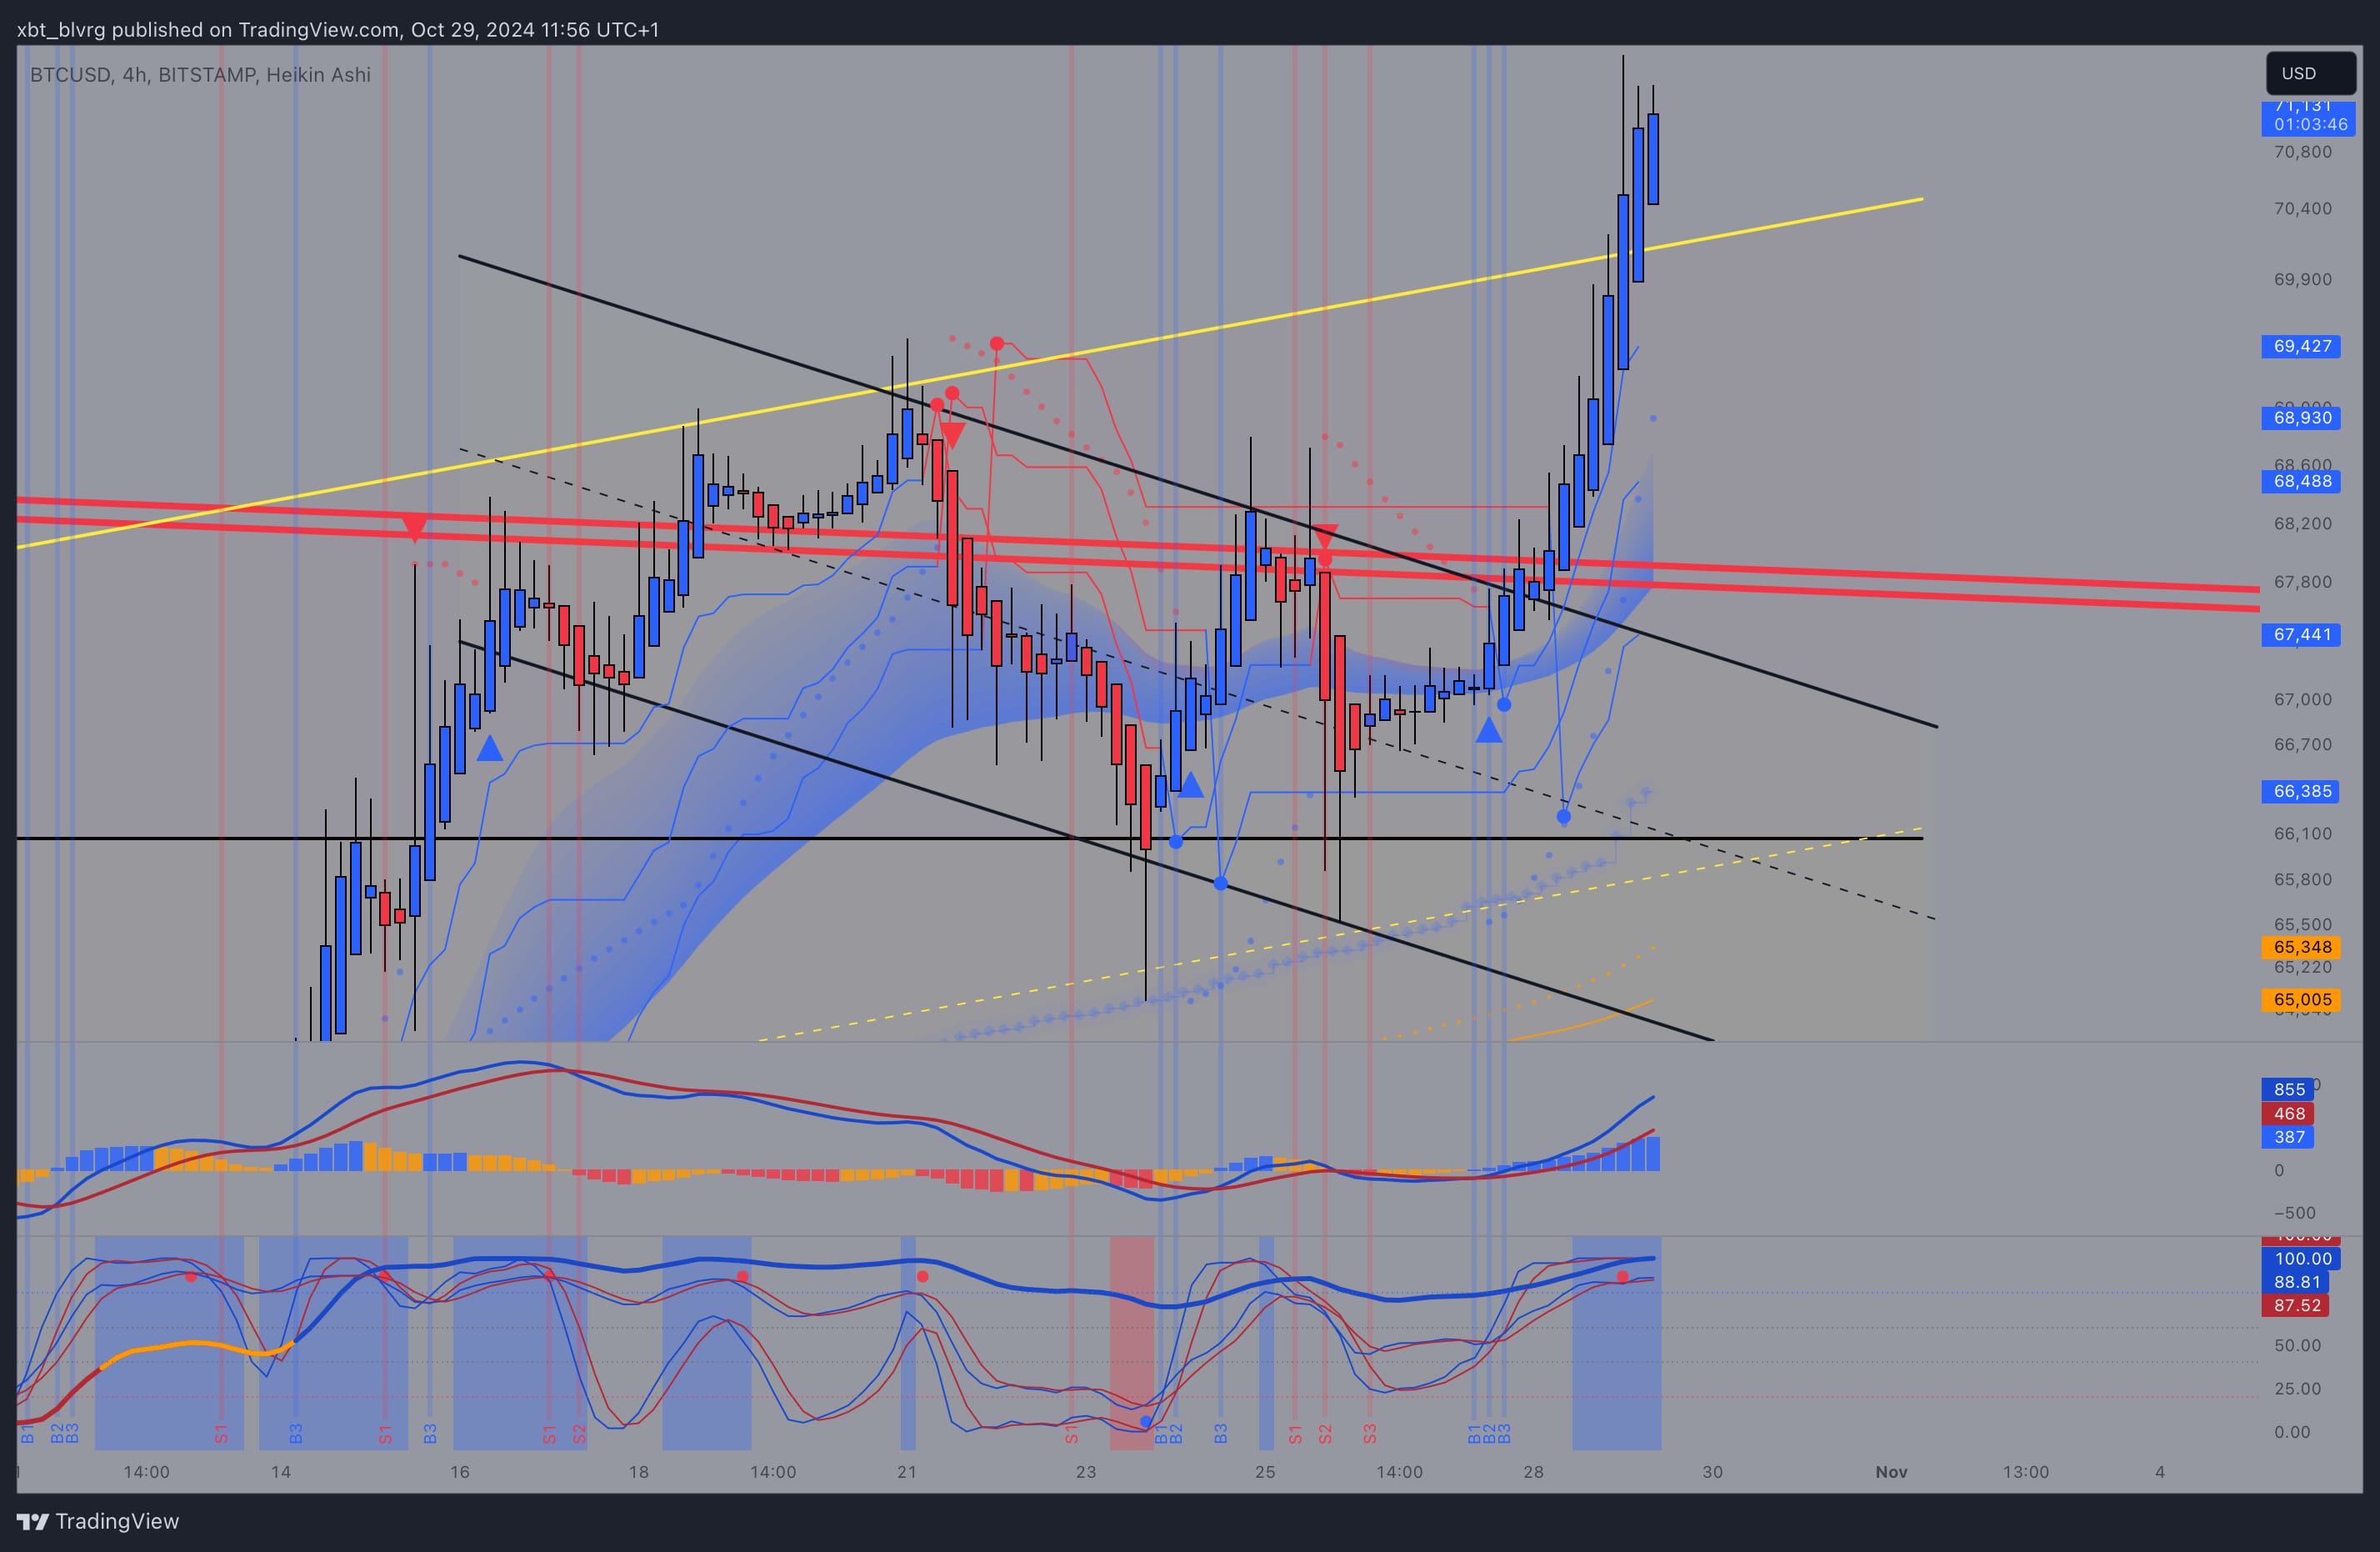
4H Chart Analysis
- Supertrends (Fast-, Mid-, Slow-ATRs): All three Supertrend lines (fast-, mid-, and slow-ATR) support the current price, indicating a strong short-term uptrend.
- MA Cloud and EMAs: The price is well above the MA cloud, showcasing significant strength in the short-term timeframe, with the MA cloud acting as a strong support if a pullback occurs.
- MACD: The MACD remains bullish, with positive histogram bars, though some flattening hints at a potential pause or minor retracement.
- Stochastic Indicators: The combined StochClose, StochRSI, and Stochastic are deeply overbought, which often precedes a pullback or consolidation period.
- Quantified 3-Factor Trading Matrix Signals: With recent buy signals (B1, B2, B3) aligning with the breakout, there’s strong support for the upward move. However, sell signals (S1, S2) could follow as the current overbought price action suggest some caution if the momentum weakens.
Conclusion for 4H: The 4H chart highlights robust bullish momentum, supported by the Supertrend and MA cloud. However, overbought stochastic indicators and the proximity to resistance levels suggest that a minor pullback or sideways consolidation could occur before further gains.
Final Conclusion
The multi-timeframe analysis indicates that BTCUSD is currently in a strong bullish phase, with the 2D, 12H, and 4H charts aligning to show upward momentum. However, overbought indicators across all timeframes suggest the possibility of a short-term consolidation or minor correction before the price continues higher.
Key support zones: MA cloud and Fibonacci levels provide a solid foundation for the uptrend, making pullbacks potential buying opportunities. Momentum is building for a further bullish move, especially if the price can hold above current support levels through any consolidation phase.